
Blanking by element number with TecPlot for hydrogeological models

This post introduces a workflow for visualizing individual model layers in TecPlot using a custom macro. The workflow overcomes the limitations of TecPlot's built-in “Value Blanking” functionality, which can produce artifacts in complex scenarios, such as when zones are out of order or cross layer boundaries. The proposed method blanks layers based on element numbers, ensuring accurate visualization of each model layer. We find this approach particularly useful when you need to isolate and explore specific layers in a model, making it ideal for producing a clear, detailed "walk-through" of your model.
TecPlot offers built-in “Value Blanking” functionality which can be used for quick investigation of individual model layers. This functionality is however somewhat lacking in complex situations. For example, if a model is built with zones out of order from their layer order, or if zones cross layer bounds, TecPlot’s value blanking by zone can produce artifacts. The basic issue is that zone or property numbering may not accurately define layers in a model.
A useful tool for properly isolating layers in a model is presented below. It bases blanking on element number, and truly captures the full extent of each layer in a model. All you need is the attached TecPlot macro (IJK_Blanking.mcr), and some information on your model layering and mesh. The attached excel sheet (IJK Blanking Spreadsheet.xlsx) will help organize this information and provide necessary values for the blanking macro.
Download the necessary files here
Step-by-step instructions:
1. Prepare Data

Figure 1: Prepare data
Load 3D model data (i.e. "R5.dat") into TecPlot. For the purposes of layer exploration, the mesh to tecplot HGS command, utilized in grok, will output the smallest 3D mesh file. The "R5.dat" file included in the example files was produced using the mesh to tecplot command.

Figure 2: Confirm new variable
In TecPlot: Data > Alter > Specify Equations (Figure 1)
In the Equation(s) text box enter: {b} = 1
Change the New var location pull down box to Cell center.
Press Compute, which should result in a successful message.
Confirm that new column titled “b” has been created by viewing Data > Spreadsheet…, make sure to select Cell center under the Value Location pulldown menu (Figure 2)
2. Load Macro
Go to: Scripting > Play Macro/Script…
Select the “IJK_Blanking.mcr” macro, the location of the macro on your system is not critical.
If you don’t see the “Quick Macro Panel” on the right of the TecPlot window, go to: Scripting > Quick Macros
You should now see a list of macros in a panel on the right of the TecPlot window, one of which should be “IJKBlankZone”. (Figure 3)
3. Prepare Data for Macro
Open: “IJK Blanking Spreadsheet.xlsx”. Input data for the macro will be prepared here. Peach coloured cells indicate values you must fill in based on your specific mesh. You can find the required information from a number of sources including the HGS project *.eco file (e.g. total # of elements/layers), within TecPlot, or the *.amproj file if you used AlgoMesh to create the model mesh.
The values presented in the lower portion of the spreadsheet will provide the values you need to enter, in order, while running the macro. (NOTE: “Zone to Blank” refers to TecPlot zone, which is associated with a timeseries, it is not the model zone.)
The attached spreadsheet contains all the correct information for the "R5.dat" file.

Figure 3: New IJKBlankZone macro
4. Run Macro
Double-click on IJKBlankZone in the Quick Macro Panel (Figure 3)
Enter the values as indicated in the spreadsheet
5. Blank out undesired layers (Figure 4)
Go to: Plot > Blanking > Value Blanking
Select Include value blanking
Under Blank entire cells when:, select primary value is blanked
For Blank when select b and is equal to constant 0 (zero)
Activate by clicking the Active checkbox.
Optionally, you may repeat the steps of Step 4: Run Macro adjusting the “Bottom Blank” and "Top Blank" values to blank successive layers. By default TecPlot does not plot the top of a volume in the middle of a model, leading to a concave look in some situations, if you are seeing this:
Zone Style… > Surfaces > Surfaces to Plot -> Exposed cell faces
If you followed the example above closely you should see results as illustrated below (i.e. blanking layers 1 & 2; Figure 5).
Perhaps the most useful application of this technique is to successively blank layers down from the top of your model to produce a layer "walk-through". Hopefully you find this feature useful, and please feel free to post any questions or comments below.

Figure 4: Value Blanking dialogue window
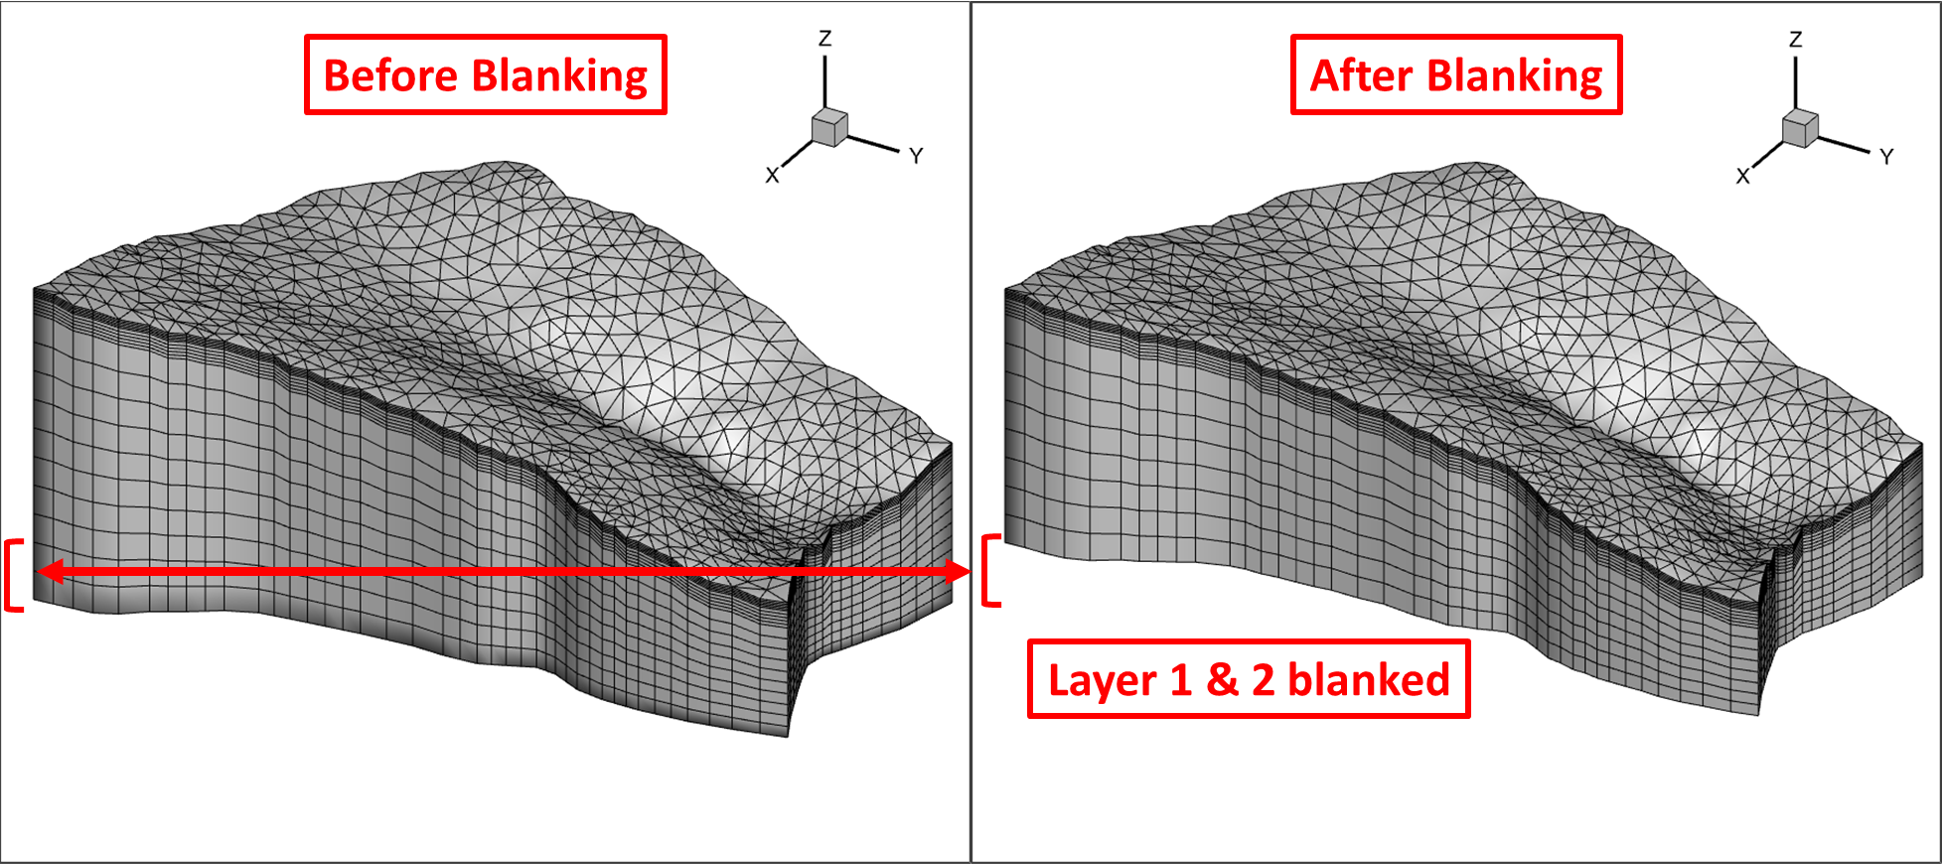
Figure 5: Resulting blanking based on element number